In this assignment, we will build an interactive dashboard to explore the Belly Button Biodiversity dataset, which catalogs the microbes that colonize human navels.
The dataset reveals that a small handful of microbial species (also called operational taxonomic units, or OTUs, in the study) were present in more than 70% of people, while the rest were relatively rare.
Methods:- Use D3.js library to read in samples.json file
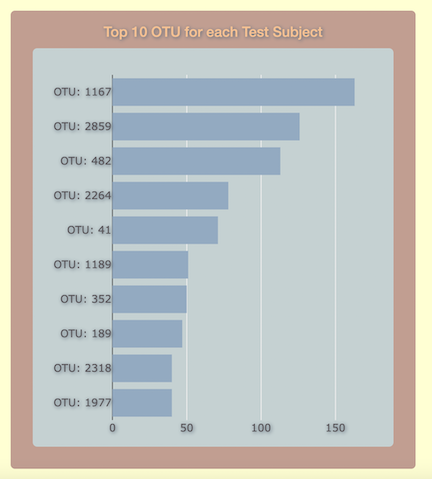
- Create a horizontal bar chart with a dropdown menu to display the top 10 OTUs found in each individual.
- Create a bubble chart to display each OTU and their representation.
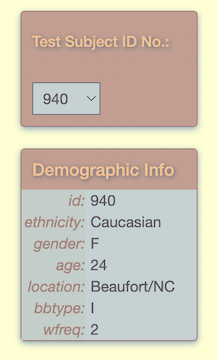
- Display the sample metadata, i.e., an individual's demographic information.
- Display each key-value pair from the metadata JSON object somewhere on the page.
- Update all the plots when a new sample is selected.
- Deploy your app to a free static page hosting service, such as GitHub Pages.